Zizipju
Candidate evidence, functional annotation and interactive gene trees
Report build: 2026-11-11 12:52 UTC
These are candidates, not confirmed biological positives. Tree and detail panels are generated only when opened. The table below and every gene detail use the same final annotation table.
1. HGT summary
OGFamily uses the native HOG when available; otherwise it uses a uniquely assigned global EXF. EXF denotes a similarity family, not a proven ortholog group. Family assignment evidence
Scroll horizontally for all columns and vertically for candidates. Click an annotation or Details to inspect its source. Descriptions and KO assignments retain source evidence. Direct gene mappings and Swiss-Prot homology transfers are distinguished in Details; unavailable assignments remain NA.
2. Flanking gene diagram
How to read this diagram
Hover over a block for the gene ID, position and classification. Blocks show ordered loci, not physical distances or strand orientation. Yellow in retained earlier results means missing classifiable evidence, not necessarily a completed zero-hit search. New hit-aware filtering skips completed no-hit/unclassifiable coding loci and extends outward; this report does not silently reselect old results.
3. Interactive trees
Tree display and rooting notes
Open a tree from the summary. The initial view uses the saved analysis root, keeps paths to the query and MSMH_OUT reference visible, and collapses other clades of four or more tips. Mixed-taxonomy clades are explicitly labelled. Click internal nodes to expand or collapse; drag to pan and use the wheel to zoom.
Root status: 0 unique MAD roots; 1 ambiguous MAD roots. A displayed root is not proof that its position is uniquely resolved. Alternative-root views and display changes do not change the reported HGT direction, scores or dates.
4. Compare (HGT vs CORE vs MMSH)
HGT vs CORE vs MMSH_OUT homologs
Notes and summary statistics
Points and displayed n count protein IDs (MMSH: unique outside homologs). Where the locus map is present, tests average transcript isoforms per physical locus; loci shared across cohorts are excluded from tests. Two-sided tests, Holm adjustment across all estimable pairs within each feature; alpha=0.05. Different letters indicate a rejected pairwise null; shared letters mean not rejected, not equivalence. n<3: no test. Exploratory comparisons do not correct for phylogenetic dependence. Reused outside homologs are counted once; matched query values are averaged per outside homolog for paired tests.
The plot-data TSV contains one row per displayed point, with its protein/reference ID, group, value and source records. Intron points are means per protein; their constituent intron IDs and values are included. Statistical tests may aggregate points by locus; see the pairwise-test file.
| feature | type | n | mean | std | letters | pairwise_tests |
|---|---|---|---|---|---|---|
| prot_len | HGT | 1 | 381.0 | 0 | HGT/CORE: Mann-Whitney U, n=1/25, Holm p=not tested; HGT/MMSH: Wilcoxon signed-rank, n=1/1, Holm p=not tested; CORE/MMSH: Mann-Whitney U, n=25/1, Holm p=not tested | |
| prot_len | CORE | 32 | 557.78125 | 506.93034 | HGT/CORE: Mann-Whitney U, n=1/25, Holm p=not tested; HGT/MMSH: Wilcoxon signed-rank, n=1/1, Holm p=not tested; CORE/MMSH: Mann-Whitney U, n=25/1, Holm p=not tested | |
| prot_len | MMSH | 1 | 391.0 | 0 | HGT/CORE: Mann-Whitney U, n=1/25, Holm p=not tested; HGT/MMSH: Wilcoxon signed-rank, n=1/1, Holm p=not tested; CORE/MMSH: Mann-Whitney U, n=25/1, Holm p=not tested | |
| cds_gc | HGT | 1 | 0.4654 | 0 | HGT/CORE: Mann-Whitney U, n=1/25, Holm p=not tested; HGT/MMSH: Wilcoxon signed-rank, n=1/1, Holm p=not tested; CORE/MMSH: Mann-Whitney U, n=25/1, Holm p=not tested | |
| cds_gc | CORE | 32 | 0.443619 | 0.020576 | HGT/CORE: Mann-Whitney U, n=1/25, Holm p=not tested; HGT/MMSH: Wilcoxon signed-rank, n=1/1, Holm p=not tested; CORE/MMSH: Mann-Whitney U, n=25/1, Holm p=not tested | |
| cds_gc | MMSH | 1 | 0.5757 | 0 | HGT/CORE: Mann-Whitney U, n=1/25, Holm p=not tested; HGT/MMSH: Wilcoxon signed-rank, n=1/1, Holm p=not tested; CORE/MMSH: Mann-Whitney U, n=25/1, Holm p=not tested | |
| gc_skew | HGT | 1 | 0.0831 | 0 | HGT/CORE: Mann-Whitney U, n=1/25, Holm p=not tested; HGT/MMSH: Wilcoxon signed-rank, n=1/1, Holm p=not tested; CORE/MMSH: Mann-Whitney U, n=25/1, Holm p=not tested | |
| gc_skew | CORE | 32 | 0.117956 | 0.088247 | HGT/CORE: Mann-Whitney U, n=1/25, Holm p=not tested; HGT/MMSH: Wilcoxon signed-rank, n=1/1, Holm p=not tested; CORE/MMSH: Mann-Whitney U, n=25/1, Holm p=not tested | |
| gc_skew | MMSH | 1 | 0.0133 | 0 | HGT/CORE: Mann-Whitney U, n=1/25, Holm p=not tested; HGT/MMSH: Wilcoxon signed-rank, n=1/1, Holm p=not tested; CORE/MMSH: Mann-Whitney U, n=25/1, Holm p=not tested | |
| cpg | HGT | 1 | 0.017009 | 0 | HGT/CORE: Mann-Whitney U, n=1/25, Holm p=not tested; HGT/MMSH: Wilcoxon signed-rank, n=1/1, Holm p=not tested; CORE/MMSH: Mann-Whitney U, n=25/1, Holm p=not tested | |
| cpg | CORE | 32 | 0.025383 | 0.009488 | HGT/CORE: Mann-Whitney U, n=1/25, Holm p=not tested; HGT/MMSH: Wilcoxon signed-rank, n=1/1, Holm p=not tested; CORE/MMSH: Mann-Whitney U, n=25/1, Holm p=not tested | |
| cpg | MMSH | 1 | 0.074043 | 0 | HGT/CORE: Mann-Whitney U, n=1/25, Holm p=not tested; HGT/MMSH: Wilcoxon signed-rank, n=1/1, Holm p=not tested; CORE/MMSH: Mann-Whitney U, n=25/1, Holm p=not tested | |
| tpa | HGT | 1 | 0.043402 | 0 | HGT/CORE: Mann-Whitney U, n=1/25, Holm p=not tested; HGT/MMSH: Wilcoxon signed-rank, n=1/1, Holm p=not tested; CORE/MMSH: Mann-Whitney U, n=25/1, Holm p=not tested | |
| tpa | CORE | 32 | 0.0448 | 0.005136 | HGT/CORE: Mann-Whitney U, n=1/25, Holm p=not tested; HGT/MMSH: Wilcoxon signed-rank, n=1/1, Holm p=not tested; CORE/MMSH: Mann-Whitney U, n=25/1, Holm p=not tested | |
| tpa | MMSH | 1 | 0.028936 | 0 | HGT/CORE: Mann-Whitney U, n=1/25, Holm p=not tested; HGT/MMSH: Wilcoxon signed-rank, n=1/1, Holm p=not tested; CORE/MMSH: Mann-Whitney U, n=25/1, Holm p=not tested | |
| rscu_dist | HGT | 1 | 2.6579 | 0 | HGT/CORE: Mann-Whitney U, n=1/25, Holm p=not tested; HGT/MMSH: Wilcoxon signed-rank, n=1/1, Holm p=not tested; CORE/MMSH: Mann-Whitney U, n=25/1, Holm p=not tested | |
| rscu_dist | CORE | 32 | 3.156066 | 1.174393 | HGT/CORE: Mann-Whitney U, n=1/25, Holm p=not tested; HGT/MMSH: Wilcoxon signed-rank, n=1/1, Holm p=not tested; CORE/MMSH: Mann-Whitney U, n=25/1, Holm p=not tested | |
| rscu_dist | MMSH | 1 | 6.8123 | 0 | HGT/CORE: Mann-Whitney U, n=1/25, Holm p=not tested; HGT/MMSH: Wilcoxon signed-rank, n=1/1, Holm p=not tested; CORE/MMSH: Mann-Whitney U, n=25/1, Holm p=not tested | |
| pfam_n | HGT | 1 | 1.0 | 0 | HGT/CORE: Mann-Whitney U, n=1/25, Holm p=not tested; HGT/MMSH: Wilcoxon signed-rank, n=1/1, Holm p=not tested; CORE/MMSH: Mann-Whitney U, n=25/1, Holm p=not tested | |
| pfam_n | CORE | 32 | 1.90625 | 1.227622 | HGT/CORE: Mann-Whitney U, n=1/25, Holm p=not tested; HGT/MMSH: Wilcoxon signed-rank, n=1/1, Holm p=not tested; CORE/MMSH: Mann-Whitney U, n=25/1, Holm p=not tested | |
| pfam_n | MMSH | 1 | 1.0 | 0 | HGT/CORE: Mann-Whitney U, n=1/25, Holm p=not tested; HGT/MMSH: Wilcoxon signed-rank, n=1/1, Holm p=not tested; CORE/MMSH: Mann-Whitney U, n=25/1, Holm p=not tested | |
| pfam_types | HGT | 1 | 1.0 | 0 | HGT/CORE: Mann-Whitney U, n=1/25, Holm p=not tested; HGT/MMSH: Wilcoxon signed-rank, n=1/1, Holm p=not tested; CORE/MMSH: Mann-Whitney U, n=25/1, Holm p=not tested | |
| pfam_types | CORE | 32 | 1.78125 | 0.97499 | HGT/CORE: Mann-Whitney U, n=1/25, Holm p=not tested; HGT/MMSH: Wilcoxon signed-rank, n=1/1, Holm p=not tested; CORE/MMSH: Mann-Whitney U, n=25/1, Holm p=not tested | |
| pfam_types | MMSH | 1 | 1.0 | 0 | HGT/CORE: Mann-Whitney U, n=1/25, Holm p=not tested; HGT/MMSH: Wilcoxon signed-rank, n=1/1, Holm p=not tested; CORE/MMSH: Mann-Whitney U, n=25/1, Holm p=not tested | |
| domain_density | HGT | 1 | 0.002625 | 0 | HGT/CORE: Mann-Whitney U, n=1/25, Holm p=not tested; HGT/MMSH: Wilcoxon signed-rank, n=1/1, Holm p=not tested; CORE/MMSH: Mann-Whitney U, n=25/1, Holm p=not tested | |
| domain_density | CORE | 32 | 0.004745 | 0.00314 | HGT/CORE: Mann-Whitney U, n=1/25, Holm p=not tested; HGT/MMSH: Wilcoxon signed-rank, n=1/1, Holm p=not tested; CORE/MMSH: Mann-Whitney U, n=25/1, Holm p=not tested | |
| domain_density | MMSH | 1 | 0.002558 | 0 | HGT/CORE: Mann-Whitney U, n=1/25, Holm p=not tested; HGT/MMSH: Wilcoxon signed-rank, n=1/1, Holm p=not tested; CORE/MMSH: Mann-Whitney U, n=25/1, Holm p=not tested | |
| intron_n | HGT | 1 | 2.0 | 0 | HGT/CORE: Mann-Whitney U, n=1/24, Holm p=not tested; HGT/MMSH: Wilcoxon signed-rank, n=1/1, Holm p=not tested; CORE/MMSH: Mann-Whitney U, n=24/1, Holm p=not tested | |
| intron_n | CORE | 30 | 9.733333 | 11.476913 | HGT/CORE: Mann-Whitney U, n=1/24, Holm p=not tested; HGT/MMSH: Wilcoxon signed-rank, n=1/1, Holm p=not tested; CORE/MMSH: Mann-Whitney U, n=24/1, Holm p=not tested | |
| intron_n | MMSH | 1 | 2.0 | 0 | HGT/CORE: Mann-Whitney U, n=1/24, Holm p=not tested; HGT/MMSH: Wilcoxon signed-rank, n=1/1, Holm p=not tested; CORE/MMSH: Mann-Whitney U, n=24/1, Holm p=not tested | |
| intron_gc | HGT | 1 | 0.3113 | 0 | HGT/CORE: Mann-Whitney U, n=1/24, Holm p=not tested; HGT/MMSH: Wilcoxon signed-rank, n=1/1, Holm p=not tested; CORE/MMSH: Mann-Whitney U, n=24/1, Holm p=not tested | |
| intron_gc | CORE | 30 | 0.314107 | 0.019128 | HGT/CORE: Mann-Whitney U, n=1/24, Holm p=not tested; HGT/MMSH: Wilcoxon signed-rank, n=1/1, Holm p=not tested; CORE/MMSH: Mann-Whitney U, n=24/1, Holm p=not tested | |
| intron_gc | MMSH | 1 | 0.3966 | 0 | HGT/CORE: Mann-Whitney U, n=1/24, Holm p=not tested; HGT/MMSH: Wilcoxon signed-rank, n=1/1, Holm p=not tested; CORE/MMSH: Mann-Whitney U, n=24/1, Holm p=not tested | |
| intron_len | HGT | 1 | 775.5 | 0 | HGT/CORE: Mann-Whitney U, n=1/24, Holm p=not tested; HGT/MMSH: Wilcoxon signed-rank, n=1/1, Holm p=not tested; CORE/MMSH: Mann-Whitney U, n=24/1, Holm p=not tested | |
| intron_len | CORE | 30 | 360.134333 | 140.777365 | HGT/CORE: Mann-Whitney U, n=1/24, Holm p=not tested; HGT/MMSH: Wilcoxon signed-rank, n=1/1, Holm p=not tested; CORE/MMSH: Mann-Whitney U, n=24/1, Holm p=not tested | |
| intron_len | MMSH | 1 | 1038.0 | 0 | HGT/CORE: Mann-Whitney U, n=1/24, Holm p=not tested; HGT/MMSH: Wilcoxon signed-rank, n=1/1, Holm p=not tested; CORE/MMSH: Mann-Whitney U, n=24/1, Holm p=not tested | |
| intron_ppt | HGT | 1 | 0.5167 | 0 | HGT/CORE: Mann-Whitney U, n=1/24, Holm p=not tested; HGT/MMSH: Wilcoxon signed-rank, n=1/1, Holm p=not tested; CORE/MMSH: Mann-Whitney U, n=24/1, Holm p=not tested | |
| intron_ppt | CORE | 30 | 0.5842 | 0.045913 | HGT/CORE: Mann-Whitney U, n=1/24, Holm p=not tested; HGT/MMSH: Wilcoxon signed-rank, n=1/1, Holm p=not tested; CORE/MMSH: Mann-Whitney U, n=24/1, Holm p=not tested | |
| intron_ppt | MMSH | 1 | 0.5333 | 0 | HGT/CORE: Mann-Whitney U, n=1/24, Holm p=not tested; HGT/MMSH: Wilcoxon signed-rank, n=1/1, Holm p=not tested; CORE/MMSH: Mann-Whitney U, n=24/1, Holm p=not tested | |
| intron_bp | HGT | 1 | 0.0 | 0 | HGT/CORE: Mann-Whitney U, n=1/24, Holm p=not tested; HGT/MMSH: Wilcoxon signed-rank, n=1/1, Holm p=not tested; CORE/MMSH: Mann-Whitney U, n=24/1, Holm p=not tested | |
| intron_bp | CORE | 30 | 0.624763 | 0.255232 | HGT/CORE: Mann-Whitney U, n=1/24, Holm p=not tested; HGT/MMSH: Wilcoxon signed-rank, n=1/1, Holm p=not tested; CORE/MMSH: Mann-Whitney U, n=24/1, Holm p=not tested | |
| intron_bp | MMSH | 1 | 0.0 | 0 | HGT/CORE: Mann-Whitney U, n=1/24, Holm p=not tested; HGT/MMSH: Wilcoxon signed-rank, n=1/1, Holm p=not tested; CORE/MMSH: Mann-Whitney U, n=24/1, Holm p=not tested |
Codon usage & composition
Notes and summary statistics
Points and displayed n count protein IDs (MMSH: unique outside homologs). Where the locus map is present, tests average transcript isoforms per physical locus; loci shared across cohorts are excluded from tests. Two-sided tests, Holm adjustment across all estimable pairs within each feature; alpha=0.05. Different letters indicate a rejected pairwise null; shared letters mean not rejected, not equivalence. n<3: no test. Exploratory comparisons do not correct for phylogenetic dependence. Reused outside homologs are counted once; matched query values are averaged per outside homolog for paired tests.
The plot-data TSV contains one row per displayed point, with its protein/reference ID, group, value and source records. Intron points are means per protein; their constituent intron IDs and values are included. Statistical tests may aggregate points by locus; see the pairwise-test file.
| feature | type | n | mean | std | letters | pairwise_tests |
|---|---|---|---|---|---|---|
| cds_gc | eukhgt | 1 | 0.4654 | 0 | eukhgt/core: Mann-Whitney U, n=1/25, Holm p=not tested | |
| cds_gc | core | 32 | 0.443619 | 0.020576 | eukhgt/core: Mann-Whitney U, n=1/25, Holm p=not tested | |
| gc_skew | eukhgt | 1 | 0.0831 | 0 | eukhgt/core: Mann-Whitney U, n=1/25, Holm p=not tested | |
| gc_skew | core | 32 | 0.117956 | 0.088247 | eukhgt/core: Mann-Whitney U, n=1/25, Holm p=not tested | |
| cpg | eukhgt | 1 | 0.017009 | 0 | eukhgt/core: Mann-Whitney U, n=1/25, Holm p=not tested | |
| cpg | core | 32 | 0.025383 | 0.009488 | eukhgt/core: Mann-Whitney U, n=1/25, Holm p=not tested | |
| tpa | eukhgt | 1 | 0.043402 | 0 | eukhgt/core: Mann-Whitney U, n=1/25, Holm p=not tested | |
| tpa | core | 32 | 0.0448 | 0.005136 | eukhgt/core: Mann-Whitney U, n=1/25, Holm p=not tested | |
| rscu_dist | eukhgt | 1 | 2.6579 | 0 | eukhgt/core: Mann-Whitney U, n=1/25, Holm p=not tested | |
| rscu_dist | core | 32 | 3.156066 | 1.174393 | eukhgt/core: Mann-Whitney U, n=1/25, Holm p=not tested |
Function motif (Pfam)
Notes and summary statistics
Points and displayed n count protein IDs (MMSH: unique outside homologs). Where the locus map is present, tests average transcript isoforms per physical locus; loci shared across cohorts are excluded from tests. Two-sided tests, Holm adjustment across all estimable pairs within each feature; alpha=0.05. Different letters indicate a rejected pairwise null; shared letters mean not rejected, not equivalence. n<3: no test. Exploratory comparisons do not correct for phylogenetic dependence. Reused outside homologs are counted once; matched query values are averaged per outside homolog for paired tests.
The plot-data TSV contains one row per displayed point, with its protein/reference ID, group, value and source records. Intron points are means per protein; their constituent intron IDs and values are included. Statistical tests may aggregate points by locus; see the pairwise-test file.
| feature | type | n | mean | std | letters | pairwise_tests |
|---|---|---|---|---|---|---|
| pfam_n | eukhgt | 1 | 1.0 | 0 | eukhgt/core: Mann-Whitney U, n=1/25, Holm p=not tested | |
| pfam_n | core | 32 | 1.90625 | 1.227622 | eukhgt/core: Mann-Whitney U, n=1/25, Holm p=not tested | |
| pfam_types | eukhgt | 1 | 1.0 | 0 | eukhgt/core: Mann-Whitney U, n=1/25, Holm p=not tested | |
| pfam_types | core | 32 | 1.78125 | 0.97499 | eukhgt/core: Mann-Whitney U, n=1/25, Holm p=not tested | |
| domain_density | eukhgt | 1 | 0.002625 | 0 | eukhgt/core: Mann-Whitney U, n=1/25, Holm p=not tested | |
| domain_density | core | 32 | 0.004745 | 0.00314 | eukhgt/core: Mann-Whitney U, n=1/25, Holm p=not tested |
Gene structure
Notes and summary statistics
Points and displayed n count protein IDs (MMSH: unique outside homologs). Where the locus map is present, tests average transcript isoforms per physical locus; loci shared across cohorts are excluded from tests. Two-sided tests, Holm adjustment across all estimable pairs within each feature; alpha=0.05. Different letters indicate a rejected pairwise null; shared letters mean not rejected, not equivalence. n<3: no test. Exploratory comparisons do not correct for phylogenetic dependence. Reused outside homologs are counted once; matched query values are averaged per outside homolog for paired tests.
The plot-data TSV contains one row per displayed point, with its protein/reference ID, group, value and source records. Intron points are means per protein; their constituent intron IDs and values are included. Statistical tests may aggregate points by locus; see the pairwise-test file.
| feature | type | n | mean | std | letters | pairwise_tests |
|---|---|---|---|---|---|---|
| prot_len | eukhgt | 1 | 381.0 | 0 | eukhgt/core: Mann-Whitney U, n=1/25, Holm p=not tested | |
| prot_len | core | 32 | 557.78125 | 506.93034 | eukhgt/core: Mann-Whitney U, n=1/25, Holm p=not tested | |
| exon_n | eukhgt | 1 | 5.0 | 0 | eukhgt/core: Mann-Whitney U, n=1/25, Holm p=not tested | |
| exon_n | core | 32 | 11.09375 | 11.504163 | eukhgt/core: Mann-Whitney U, n=1/25, Holm p=not tested | |
| ss5_score | eukhgt | 1 | 0.1667 | 0 | eukhgt/core: Mann-Whitney U, n=1/25, Holm p=not tested | |
| ss5_score | core | 32 | 0.390416 | 0.219179 | eukhgt/core: Mann-Whitney U, n=1/25, Holm p=not tested | |
| ss3_score | eukhgt | 1 | 0.125 | 0 | eukhgt/core: Mann-Whitney U, n=1/25, Holm p=not tested | |
| ss3_score | core | 32 | 0.400419 | 0.282074 | eukhgt/core: Mann-Whitney U, n=1/25, Holm p=not tested |
Intron features
Notes and summary statistics
Points and displayed n count protein IDs (MMSH: unique outside homologs). Where the locus map is present, tests average transcript isoforms per physical locus; loci shared across cohorts are excluded from tests. Two-sided tests, Holm adjustment across all estimable pairs within each feature; alpha=0.05. Different letters indicate a rejected pairwise null; shared letters mean not rejected, not equivalence. n<3: no test. Exploratory comparisons do not correct for phylogenetic dependence. Reused outside homologs are counted once; matched query values are averaged per outside homolog for paired tests.
The plot-data TSV contains one row per displayed point, with its protein/reference ID, group, value and source records. Intron points are means per protein; their constituent intron IDs and values are included. Statistical tests may aggregate points by locus; see the pairwise-test file.
| feature | type | n | mean | std | letters | pairwise_tests |
|---|---|---|---|---|---|---|
| intron_n | eukhgt | 1 | 2.0 | 0 | eukhgt/core: Mann-Whitney U, n=1/24, Holm p=not tested | |
| intron_n | core | 30 | 9.733333 | 11.476913 | eukhgt/core: Mann-Whitney U, n=1/24, Holm p=not tested | |
| intron_gc | eukhgt | 1 | 0.3113 | 0 | eukhgt/core: Mann-Whitney U, n=1/24, Holm p=not tested | |
| intron_gc | core | 30 | 0.314107 | 0.019128 | eukhgt/core: Mann-Whitney U, n=1/24, Holm p=not tested | |
| intron_len | eukhgt | 1 | 775.5 | 0 | eukhgt/core: Mann-Whitney U, n=1/24, Holm p=not tested | |
| intron_len | core | 30 | 360.134333 | 140.777365 | eukhgt/core: Mann-Whitney U, n=1/24, Holm p=not tested | |
| intron_ppt | eukhgt | 1 | 0.5167 | 0 | eukhgt/core: Mann-Whitney U, n=1/24, Holm p=not tested | |
| intron_ppt | core | 30 | 0.5842 | 0.045913 | eukhgt/core: Mann-Whitney U, n=1/24, Holm p=not tested | |
| intron_bp | eukhgt | 1 | 0.0 | 0 | eukhgt/core: Mann-Whitney U, n=1/24, Holm p=not tested | |
| intron_bp | core | 30 | 0.624763 | 0.255232 | eukhgt/core: Mann-Whitney U, n=1/24, Holm p=not tested | |
| intron_relpos | eukhgt | 1 | 0.5587 | 0 | eukhgt/core: Mann-Whitney U, n=1/24, Holm p=not tested | |
| intron_relpos | core | 30 | 0.525377 | 0.098068 | eukhgt/core: Mann-Whitney U, n=1/24, Holm p=not tested |
Adaptive evolution (dN/dS)
Notes and summary statistics
Points and displayed n count protein IDs (MMSH: unique outside homologs). Where the locus map is present, tests average transcript isoforms per physical locus; loci shared across cohorts are excluded from tests. Two-sided tests, Holm adjustment across all estimable pairs within each feature; alpha=0.05. Different letters indicate a rejected pairwise null; shared letters mean not rejected, not equivalence. n<3: no test. Exploratory comparisons do not correct for phylogenetic dependence. Reused outside homologs are counted once; matched query values are averaged per outside homolog for paired tests.
The plot-data TSV contains one row per displayed point, with its protein/reference ID, group, value and source records. Intron points are means per protein; their constituent intron IDs and values are included. Statistical tests may aggregate points by locus; see the pairwise-test file.
| feature | type | value |
|---|---|---|
| dnds | HGT | 0.0858202 |
Summary table
| feature | prohgt | eukhgt | virhgt | hgt | core |
|---|---|---|---|---|---|
| gc_skew | NA | 0.0831 | NA | NA | 0.118 |
| cds_gc | NA | 0.4654 | NA | NA | 0.4436 |
| cpg | NA | 0.017 | NA | NA | 0.0254 |
| tpa | NA | 0.0434 | NA | NA | 0.0448 |
| prot_len | NA | 381.0 | NA | NA | 557.7812 |
| rscu_dist | NA | 2.6579 | NA | NA | 3.1561 |
| utr5 | NA | NA | NA | NA | NA |
| utr3 | NA | NA | NA | NA | NA |
| exon_n | NA | 5.0 | NA | NA | 11.0938 |
| ss5_score | NA | 0.1667 | NA | NA | 0.3904 |
| ss3_score | NA | 0.125 | NA | NA | 0.4004 |
| pfam_n | NA | 1.0 | NA | NA | 1.9062 |
| pfam_types | NA | 1.0 | NA | NA | 1.7812 |
| domain_density | NA | 0.0026 | NA | NA | 0.0047 |
| dnds | NA | 0.0858 | NA | NA | NA |
| intron_n | NA | 2.0 | NA | NA | 9.7333 |
| intron_gc | NA | 0.3113 | NA | NA | 0.3141 |
| intron_len | NA | 775.5 | NA | NA | 360.1343 |
| intron_ppt | NA | 0.5167 | NA | NA | 0.5842 |
| intron_bp | NA | 0.0 | NA | NA | 0.6248 |
| intron_p0 | NA | 0.5 | NA | NA | 0.648 |
| intron_p1 | NA | 0.0 | NA | NA | 0.2263 |
| intron_p2 | NA | 0.5 | NA | NA | 0.1257 |
| intron_relpos | NA | 0.5587 | NA | NA | 0.5254 |
| intron_gtag | NA | 1.0 | NA | NA | 0.9736 |
| intron_gcag | NA | 0.0 | NA | NA | 0.0088 |
| intron_atac | NA | 0.0 | NA | NA | 0.0067 |
| intron_noncanon | NA | 0.0 | NA | NA | 0.0108 |
5. Codon usage
Effective number of codons (Nc)
Notes and summary statistics
Points and displayed n count protein IDs (MMSH: unique outside homologs). Where the locus map is present, tests average transcript isoforms per physical locus; loci shared across cohorts are excluded from tests. Two-sided tests, Holm adjustment across all estimable pairs within each feature; alpha=0.05. Different letters indicate a rejected pairwise null; shared letters mean not rejected, not equivalence. n<3: no test. Exploratory comparisons do not correct for phylogenetic dependence. Reused outside homologs are counted once; matched query values are averaged per outside homolog for paired tests.
The plot-data TSV contains one row per displayed point, with its protein/reference ID, group, value and source records. Intron points are means per protein; their constituent intron IDs and values are included. Statistical tests may aggregate points by locus; see the pairwise-test file.
| feature | type | n | mean | std | letters | pairwise_tests |
|---|---|---|---|---|---|---|
| Nc | eukhgt | 1 | 51.39 | 0 | eukhgt/core: Mann-Whitney U, n=1/25, Holm p=not tested | |
| Nc | core | 32 | 53.326875 | 3.69364 | eukhgt/core: Mann-Whitney U, n=1/25, Holm p=not tested |
Codon usage indices
Notes and summary statistics
Points and displayed n count protein IDs (MMSH: unique outside homologs). Where the locus map is present, tests average transcript isoforms per physical locus; loci shared across cohorts are excluded from tests. Two-sided tests, Holm adjustment across all estimable pairs within each feature; alpha=0.05. Different letters indicate a rejected pairwise null; shared letters mean not rejected, not equivalence. n<3: no test. Exploratory comparisons do not correct for phylogenetic dependence. Reused outside homologs are counted once; matched query values are averaged per outside homolog for paired tests.
The plot-data TSV contains one row per displayed point, with its protein/reference ID, group, value and source records. Intron points are means per protein; their constituent intron IDs and values are included. Statistical tests may aggregate points by locus; see the pairwise-test file.
| feature | type | n | mean | std | letters | pairwise_tests |
|---|---|---|---|---|---|---|
| CAI | eukhgt | 1 | 0.213 | 0 | eukhgt/core: Mann-Whitney U, n=1/25, Holm p=not tested | |
| CAI | core | 32 | 0.200625 | 0.016951 | eukhgt/core: Mann-Whitney U, n=1/25, Holm p=not tested | |
| GC3s | eukhgt | 1 | 0.361 | 0 | eukhgt/core: Mann-Whitney U, n=1/25, Holm p=not tested | |
| GC3s | core | 32 | 0.401625 | 0.060679 | eukhgt/core: Mann-Whitney U, n=1/25, Holm p=not tested | |
| GC | eukhgt | 1 | 0.464 | 0 | eukhgt/core: Mann-Whitney U, n=1/25, Holm p=not tested | |
| GC | core | 32 | 0.444937 | 0.021283 | eukhgt/core: Mann-Whitney U, n=1/25, Holm p=not tested | |
| Gravy | eukhgt | 1 | -0.123097 | 0 | eukhgt/core: Mann-Whitney U, n=1/25, Holm p=not tested | |
| Gravy | core | 32 | -0.466947 | 0.445488 | eukhgt/core: Mann-Whitney U, n=1/25, Holm p=not tested | |
| Aromo | eukhgt | 1 | 0.08399 | 0 | eukhgt/core: Mann-Whitney U, n=1/25, Holm p=not tested | |
| Aromo | core | 32 | 0.080336 | 0.025107 | eukhgt/core: Mann-Whitney U, n=1/25, Holm p=not tested | |
| CBI | eukhgt | 1 | -0.04 | 0 | eukhgt/core: Mann-Whitney U, n=1/25, Holm p=not tested | |
| CBI | core | 32 | -0.071531 | 0.049477 | eukhgt/core: Mann-Whitney U, n=1/25, Holm p=not tested | |
| Fop | eukhgt | 1 | 0.394 | 0 | eukhgt/core: Mann-Whitney U, n=1/25, Holm p=not tested | |
| Fop | core | 32 | 0.377375 | 0.029369 | eukhgt/core: Mann-Whitney U, n=1/25, Holm p=not tested |
Codon usage: HGT vs CORE vs MMSH_OUT
Notes and summary statistics
Points and displayed n count protein IDs (MMSH: unique outside homologs). Where the locus map is present, tests average transcript isoforms per physical locus; loci shared across cohorts are excluded from tests. Two-sided tests, Holm adjustment across all estimable pairs within each feature; alpha=0.05. Different letters indicate a rejected pairwise null; shared letters mean not rejected, not equivalence. n<3: no test. Exploratory comparisons do not correct for phylogenetic dependence. Reused outside homologs are counted once; matched query values are averaged per outside homolog for paired tests.
The plot-data TSV contains one row per displayed point, with its protein/reference ID, group, value and source records. Intron points are means per protein; their constituent intron IDs and values are included. Statistical tests may aggregate points by locus; see the pairwise-test file.
| feature | type | n | mean | std | letters | pairwise_tests |
|---|---|---|---|---|---|---|
| CAI | HGT | 1 | 0.213 | 0 | HGT/CORE: Mann-Whitney U, n=1/25, Holm p=not tested; HGT/MMSH: Wilcoxon signed-rank, n=1/1, Holm p=not tested; CORE/MMSH: Mann-Whitney U, n=25/1, Holm p=not tested | |
| CAI | CORE | 32 | 0.200625 | 0.016951 | HGT/CORE: Mann-Whitney U, n=1/25, Holm p=not tested; HGT/MMSH: Wilcoxon signed-rank, n=1/1, Holm p=not tested; CORE/MMSH: Mann-Whitney U, n=25/1, Holm p=not tested | |
| CAI | MMSH | 1 | 0.228 | 0 | HGT/CORE: Mann-Whitney U, n=1/25, Holm p=not tested; HGT/MMSH: Wilcoxon signed-rank, n=1/1, Holm p=not tested; CORE/MMSH: Mann-Whitney U, n=25/1, Holm p=not tested | |
| CBI | HGT | 1 | -0.04 | 0 | HGT/CORE: Mann-Whitney U, n=1/25, Holm p=not tested; HGT/MMSH: Wilcoxon signed-rank, n=1/1, Holm p=not tested; CORE/MMSH: Mann-Whitney U, n=25/1, Holm p=not tested | |
| CBI | CORE | 32 | -0.071531 | 0.049477 | HGT/CORE: Mann-Whitney U, n=1/25, Holm p=not tested; HGT/MMSH: Wilcoxon signed-rank, n=1/1, Holm p=not tested; CORE/MMSH: Mann-Whitney U, n=25/1, Holm p=not tested | |
| CBI | MMSH | 1 | 0.107 | 0 | HGT/CORE: Mann-Whitney U, n=1/25, Holm p=not tested; HGT/MMSH: Wilcoxon signed-rank, n=1/1, Holm p=not tested; CORE/MMSH: Mann-Whitney U, n=25/1, Holm p=not tested | |
| Fop | HGT | 1 | 0.394 | 0 | HGT/CORE: Mann-Whitney U, n=1/25, Holm p=not tested; HGT/MMSH: Wilcoxon signed-rank, n=1/1, Holm p=not tested; CORE/MMSH: Mann-Whitney U, n=25/1, Holm p=not tested | |
| Fop | CORE | 32 | 0.377375 | 0.029369 | HGT/CORE: Mann-Whitney U, n=1/25, Holm p=not tested; HGT/MMSH: Wilcoxon signed-rank, n=1/1, Holm p=not tested; CORE/MMSH: Mann-Whitney U, n=25/1, Holm p=not tested | |
| Fop | MMSH | 1 | 0.48 | 0 | HGT/CORE: Mann-Whitney U, n=1/25, Holm p=not tested; HGT/MMSH: Wilcoxon signed-rank, n=1/1, Holm p=not tested; CORE/MMSH: Mann-Whitney U, n=25/1, Holm p=not tested | |
| Nc | HGT | 1 | 51.39 | 0 | HGT/CORE: Mann-Whitney U, n=1/25, Holm p=not tested; HGT/MMSH: Wilcoxon signed-rank, n=1/1, Holm p=not tested; CORE/MMSH: Mann-Whitney U, n=25/1, Holm p=not tested | |
| Nc | CORE | 32 | 53.326875 | 3.69364 | HGT/CORE: Mann-Whitney U, n=1/25, Holm p=not tested; HGT/MMSH: Wilcoxon signed-rank, n=1/1, Holm p=not tested; CORE/MMSH: Mann-Whitney U, n=25/1, Holm p=not tested | |
| Nc | MMSH | 1 | 50.31 | 0 | HGT/CORE: Mann-Whitney U, n=1/25, Holm p=not tested; HGT/MMSH: Wilcoxon signed-rank, n=1/1, Holm p=not tested; CORE/MMSH: Mann-Whitney U, n=25/1, Holm p=not tested | |
| GC3s | HGT | 1 | 0.361 | 0 | HGT/CORE: Mann-Whitney U, n=1/25, Holm p=not tested; HGT/MMSH: Wilcoxon signed-rank, n=1/1, Holm p=not tested; CORE/MMSH: Mann-Whitney U, n=25/1, Holm p=not tested | |
| GC3s | CORE | 32 | 0.401625 | 0.060679 | HGT/CORE: Mann-Whitney U, n=1/25, Holm p=not tested; HGT/MMSH: Wilcoxon signed-rank, n=1/1, Holm p=not tested; CORE/MMSH: Mann-Whitney U, n=25/1, Holm p=not tested | |
| GC3s | MMSH | 1 | 0.653 | 0 | HGT/CORE: Mann-Whitney U, n=1/25, Holm p=not tested; HGT/MMSH: Wilcoxon signed-rank, n=1/1, Holm p=not tested; CORE/MMSH: Mann-Whitney U, n=25/1, Holm p=not tested | |
| GC | HGT | 1 | 0.464 | 0 | HGT/CORE: Mann-Whitney U, n=1/25, Holm p=not tested; HGT/MMSH: Wilcoxon signed-rank, n=1/1, Holm p=not tested; CORE/MMSH: Mann-Whitney U, n=25/1, Holm p=not tested | |
| GC | CORE | 32 | 0.444937 | 0.021283 | HGT/CORE: Mann-Whitney U, n=1/25, Holm p=not tested; HGT/MMSH: Wilcoxon signed-rank, n=1/1, Holm p=not tested; CORE/MMSH: Mann-Whitney U, n=25/1, Holm p=not tested | |
| GC | MMSH | 1 | 0.576 | 0 | HGT/CORE: Mann-Whitney U, n=1/25, Holm p=not tested; HGT/MMSH: Wilcoxon signed-rank, n=1/1, Holm p=not tested; CORE/MMSH: Mann-Whitney U, n=25/1, Holm p=not tested | |
| Gravy | HGT | 1 | -0.123097 | 0 | HGT/CORE: Mann-Whitney U, n=1/25, Holm p=not tested; HGT/MMSH: Wilcoxon signed-rank, n=1/1, Holm p=not tested; CORE/MMSH: Mann-Whitney U, n=25/1, Holm p=not tested | |
| Gravy | CORE | 32 | -0.466947 | 0.445488 | HGT/CORE: Mann-Whitney U, n=1/25, Holm p=not tested; HGT/MMSH: Wilcoxon signed-rank, n=1/1, Holm p=not tested; CORE/MMSH: Mann-Whitney U, n=25/1, Holm p=not tested | |
| Gravy | MMSH | 1 | -0.240921 | 0 | HGT/CORE: Mann-Whitney U, n=1/25, Holm p=not tested; HGT/MMSH: Wilcoxon signed-rank, n=1/1, Holm p=not tested; CORE/MMSH: Mann-Whitney U, n=25/1, Holm p=not tested | |
| Aromo | HGT | 1 | 0.08399 | 0 | HGT/CORE: Mann-Whitney U, n=1/25, Holm p=not tested; HGT/MMSH: Wilcoxon signed-rank, n=1/1, Holm p=not tested; CORE/MMSH: Mann-Whitney U, n=25/1, Holm p=not tested | |
| Aromo | CORE | 32 | 0.080336 | 0.025107 | HGT/CORE: Mann-Whitney U, n=1/25, Holm p=not tested; HGT/MMSH: Wilcoxon signed-rank, n=1/1, Holm p=not tested; CORE/MMSH: Mann-Whitney U, n=25/1, Holm p=not tested | |
| Aromo | MMSH | 1 | 0.084399 | 0 | HGT/CORE: Mann-Whitney U, n=1/25, Holm p=not tested; HGT/MMSH: Wilcoxon signed-rank, n=1/1, Holm p=not tested; CORE/MMSH: Mann-Whitney U, n=25/1, Holm p=not tested |
6. Intron statistics
Intron proportions & scores
Notes and summary statistics
Points and displayed n count protein IDs (MMSH: unique outside homologs). Where the locus map is present, tests average transcript isoforms per physical locus; loci shared across cohorts are excluded from tests. Two-sided tests, Holm adjustment across all estimable pairs within each feature; alpha=0.05. Different letters indicate a rejected pairwise null; shared letters mean not rejected, not equivalence. n<3: no test. Exploratory comparisons do not correct for phylogenetic dependence. Reused outside homologs are counted once; matched query values are averaged per outside homolog for paired tests.
The plot-data TSV contains one row per displayed point, with its protein/reference ID, group, value and source records. Intron points are means per protein; their constituent intron IDs and values are included. Statistical tests may aggregate points by locus; see the pairwise-test file.
| feature | type | n | mean | std | letters | pairwise_tests |
|---|---|---|---|---|---|---|
| gc_content | eukhgt | 1 | 31.13 | 0 | eukhgt/core: Mann-Whitney U, n=1/24, Holm p=not tested | |
| gc_content | core | 30 | 31.260749 | 1.988372 | eukhgt/core: Mann-Whitney U, n=1/24, Holm p=not tested | |
| ppt_score | eukhgt | 1 | 0.5165 | 0 | eukhgt/core: Mann-Whitney U, n=1/24, Holm p=not tested | |
| ppt_score | core | 30 | 0.582287 | 0.047528 | eukhgt/core: Mann-Whitney U, n=1/24, Holm p=not tested | |
| rel_position | eukhgt | 1 | 0.5587 | 0 | eukhgt/core: Mann-Whitney U, n=1/24, Holm p=not tested | |
| rel_position | core | 30 | 0.521058 | 0.099779 | eukhgt/core: Mann-Whitney U, n=1/24, Holm p=not tested |
Intron length
Notes and summary statistics
Points and displayed n count protein IDs (MMSH: unique outside homologs). Where the locus map is present, tests average transcript isoforms per physical locus; loci shared across cohorts are excluded from tests. Two-sided tests, Holm adjustment across all estimable pairs within each feature; alpha=0.05. Different letters indicate a rejected pairwise null; shared letters mean not rejected, not equivalence. n<3: no test. Exploratory comparisons do not correct for phylogenetic dependence. Reused outside homologs are counted once; matched query values are averaged per outside homolog for paired tests.
The plot-data TSV contains one row per displayed point, with its protein/reference ID, group, value and source records. Intron points are means per protein; their constituent intron IDs and values are included. Statistical tests may aggregate points by locus; see the pairwise-test file.
| feature | type | n | mean | std | letters | pairwise_tests |
|---|---|---|---|---|---|---|
| length | eukhgt | 1 | 775.5 | 0 | eukhgt/core: Mann-Whitney U, n=1/24, Holm p=not tested | |
| length | core | 30 | 366.731112 | 140.114049 | eukhgt/core: Mann-Whitney U, n=1/24, Holm p=not tested |
| type | total_genes | genes_with_introns | intron_gene_ratio_pct | total_introns | avg_introns_per_gene | introns_with_hits | introns_with_hits_ratio_pct | self_hit_introns | self_hit_ratio_pct | avg_gc_content | avg_length | avg_ppt_score | branch_point_ratio | phase_0_pct | phase_1_pct | phase_2_pct | avg_rel_position | splice_GT-AG | splice_GC-AG | splice_AT-AC | splice_non-canonical | exon_hits | intergenic_hits |
|---|---|---|---|---|---|---|---|---|---|---|---|---|---|---|---|---|---|---|---|---|---|---|---|
| prohgt | 0 | 0 | 0.00 | 0 | 0.00 | 0 | 0.00 | 0 | 0.00 | 0.00 | 0.0 | 0.000 | 0.000 | 0.0 | 0.0 | 0.0 | 0.5000 | 0 | 0 | 0 | 0 | 0 | 0 |
| eukhgt | 0 | 0 | 0.00 | 0 | 0.00 | 0 | 0.00 | 0 | 0.00 | 0.00 | 0.0 | 0.000 | 0.000 | 0.0 | 0.0 | 0.0 | 0.5000 | 0 | 0 | 0 | 0 | 0 | 0 |
| hgt | 1 | 1 | 100.00 | 2 | 2.00 | 0 | 0.00 | 2 | 100.00 | 31.13 | 775.5 | 0.517 | 0.000 | 50.0 | 0.0 | 50.0 | 0.5587 | 2 | 0 | 0 | 0 | 0 | 0 |
| core | 32 | 30 | 93.75 | 287 | 9.57 | 36 | 12.54 | 141 | 49.13 | 31.04 | 344.1 | 0.595 | 0.624 | 65.2 | 23.7 | 11.1 | 0.5050 | 281 | 3 | 2 | 1 | 0 | 36 |
| NA | 2555 | 2555 | 100.00 | 15535 | 6.08 | 945 | 6.08 | 10056 | 64.73 | 30.82 | 417.1 | 0.579 | 0.630 | 61.5 | 19.1 | 19.4 | 0.5028 | 15003 | 276 | 17 | 239 | 211 | 1312 |
7. Functional enrichment: HGT relative to CORE
| Annotation | HGT loci | CORE loci | Tests | FDR < 0.05 |
|---|---|---|---|---|
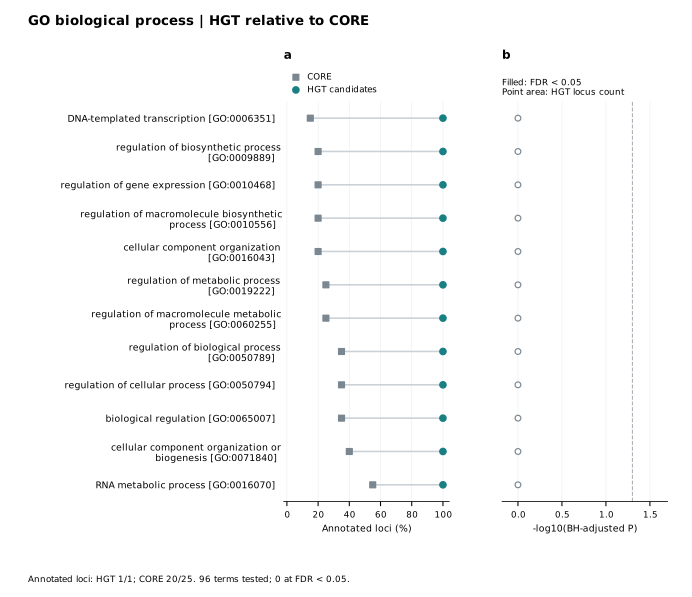
| GO biological process | 1/1 | 20/25 | 96 | 0 |
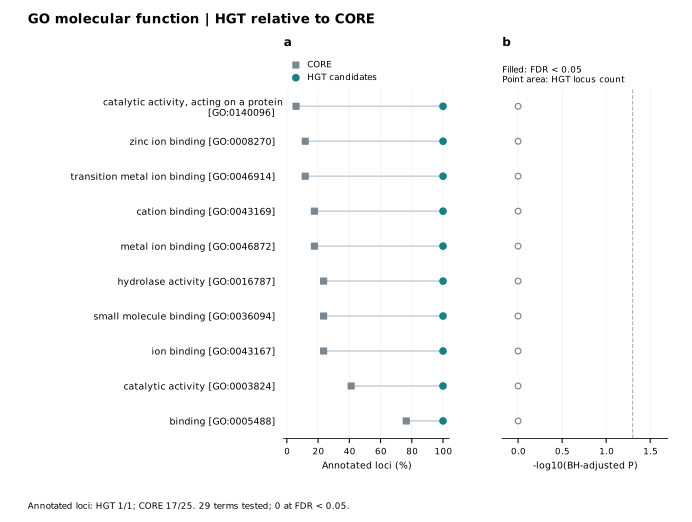
| GO molecular function | 1/1 | 17/25 | 29 | 0 |
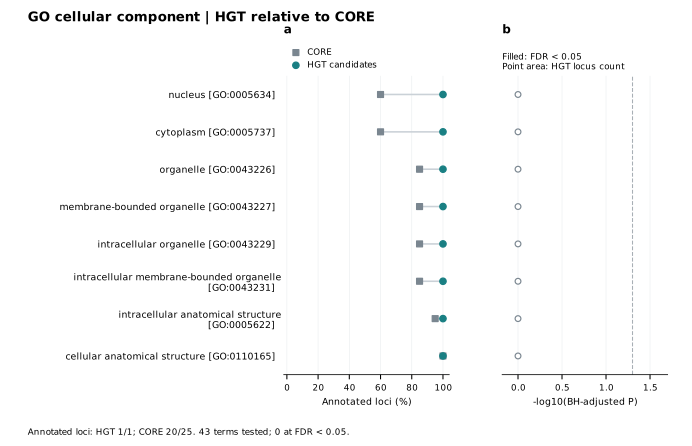
| GO cellular component | 1/1 | 20/25 | 43 | 0 |
| KEGG pathways | 0/1 | 13/25 | 0 | 0 |
| eggNOG functional categories | 1/1 | 19/25 | 6 | 0 |
KEGG pathways: the pathway mapping cache is incomplete. No enrichment P values were computed for this namespace. Public KEGG cross-reference lookups may be retried when the KEGG service is reachable.
GO biological process
Methods and interpretation
One physical coding locus; annotations unioned across its isoforms; shared HGT/CORE loci excluded. One-sided Fisher exact test (HGT enrichment), BH across all tested terms in each namespace; combined term count >=2 before testing. Loci with usable annotations in each namespace; no-hit, no-term and unresolved mapping excluded. All-locus sensitivity is also reported. is_a and part_of closure; obsolete terms resolve only with one replacement; three roots omitted. Exact Swiss-Prot KEGG gene to organism pathway links; pathways normalized to map IDs. Global maps 01100, 01110 and 01120 omitted. Exact KOG/COG IDs to NCBI functional-category letters; unmapped ENOG identifiers excluded, not guessed. Exploratory comparison with conserved BUSCO-derived CORE, not the whole genome. Homology-transferred annotations, unequal coverage and evolutionary dependence limit causal inference. HGT labels are candidates.
Point coordinates and exact counts are supplied for every displayed term. The contributor file links each term to coding loci and protein identifiers. Unfilled points are not significant; there is no forced enrichment.
GO molecular function
Methods and interpretation
One physical coding locus; annotations unioned across its isoforms; shared HGT/CORE loci excluded. One-sided Fisher exact test (HGT enrichment), BH across all tested terms in each namespace; combined term count >=2 before testing. Loci with usable annotations in each namespace; no-hit, no-term and unresolved mapping excluded. All-locus sensitivity is also reported. is_a and part_of closure; obsolete terms resolve only with one replacement; three roots omitted. Exact Swiss-Prot KEGG gene to organism pathway links; pathways normalized to map IDs. Global maps 01100, 01110 and 01120 omitted. Exact KOG/COG IDs to NCBI functional-category letters; unmapped ENOG identifiers excluded, not guessed. Exploratory comparison with conserved BUSCO-derived CORE, not the whole genome. Homology-transferred annotations, unequal coverage and evolutionary dependence limit causal inference. HGT labels are candidates.
Point coordinates and exact counts are supplied for every displayed term. The contributor file links each term to coding loci and protein identifiers. Unfilled points are not significant; there is no forced enrichment.
GO cellular component
Methods and interpretation
One physical coding locus; annotations unioned across its isoforms; shared HGT/CORE loci excluded. One-sided Fisher exact test (HGT enrichment), BH across all tested terms in each namespace; combined term count >=2 before testing. Loci with usable annotations in each namespace; no-hit, no-term and unresolved mapping excluded. All-locus sensitivity is also reported. is_a and part_of closure; obsolete terms resolve only with one replacement; three roots omitted. Exact Swiss-Prot KEGG gene to organism pathway links; pathways normalized to map IDs. Global maps 01100, 01110 and 01120 omitted. Exact KOG/COG IDs to NCBI functional-category letters; unmapped ENOG identifiers excluded, not guessed. Exploratory comparison with conserved BUSCO-derived CORE, not the whole genome. Homology-transferred annotations, unequal coverage and evolutionary dependence limit causal inference. HGT labels are candidates.
Point coordinates and exact counts are supplied for every displayed term. The contributor file links each term to coding loci and protein identifiers. Unfilled points are not significant; there is no forced enrichment.
Annotation coverage and provenance
HGT and CORE proteins were searched together with the same Swiss-Prot index, accession map, DIAMOND and parameters. These enrichment annotations are a separate matched comparison; the main candidate table is unchanged.
Coverage Per-protein evidence Methods, resources and all resultsInterpretation notes
INnode and OUTnode label the query side and partner side without assuming transfer direction. DirectionScore describes support across recorded root scenarios, not a posterior probability. Conditional timeHGT values estimate within-recipient gene divergence, not the transfer instant; inspect age-bound sensitivity in Details.
proHGT and eukHGT compare the taxonomy of MSMH_OUT independently of inferred transfer direction; an outside-homolog association is not a confirmed donor. MMSH CDS features require a verified protein/CDS match. Features with unavailable or inconsistent CDS remain missing. Protein length and directly scanned Pfam features can still be compared. CodonW indices use the same reference settings for query and MMSH. Intron comparisons use one mean per gene.
EXF IDs represent global sequence-similarity families, not proven orthogroups or duplication events. Swiss-Prot terms are homology-based transfers. Missing evidence stays NA.